Deploy Core Stack (Helm chart)
Helm is an easy way to deploy kubernetes resources.
Note
Helm is a tool to create kubernetes deployment templates, versioning, upgrade, installation and more. Helm official documentation: https://helm.sh
First, we need to clone helm chart and update dependencies
git clone https://github.com/One-Green/helm.git
cd helm
# one-green stack have other chart dependencies, to download these dependencies run:
helm dependencies update
As example for Raspberry Pi deployment, we already created values.yaml file named values_raspberry_pi_microk8s.yaml.
Note
values.yaml is one of the way used by helm to install/upgrade a kubernetes deployment. Keep this files versioned or backup if you wan’t to deploy again, with same configuration.
In file values_raspberry_pi_microk8s.yaml, line 75, replace 192.168.0.5 by your Raspberry Pi IP or host. Now once done, it’s time to deploy.
sudo microk8s helm3 upgrade  one-green-core -f values_raspberry_pi_microk8s.yaml . --namespace default --install
# will output something like:
# Release "one-green-core" does not exist. Installing it now.
# NAME: one-green-core
# LAST DEPLOYED: Tue Feb  2 23:32:06 2021
# NAMESPACE: default
# STATUS: deployed
# REVISION: 1

# watch until deployment is done
sudo microk8s kubectl get po --watch
# NAME                                      READY   STATUS              RESTARTS   AGE
# one-green-core-ui-5497dd678f-dnb95        0/1     ContainerCreating   0          65s
# one-green-core-sprinklers-controller-0    0/1     ContainerCreating   0          64s
# one-green-core-api-756dfd65d7-snrkk       0/1     Init:0/1            0          64s
# one-green-core-telegraf-0                 0/1     ContainerCreating   0          64s
# one-green-core-mqtt-0                     0/1     ContainerCreating   0          64s
# one-green-core-water-controller-0         0/1     ContainerCreating   0          64s
# one-green-core-tsdb-0                     0/1     ContainerCreating   0          64s
# one-green-core-grafana-7886f7d45f-58fzt   0/1     PodInitializing     0          64s
# one-green-core-influxdb-0                 0/1     ContainerCreating   0          61s
If deployment is done
# do CTL+C to quit and reuse  "sudo microk8s kubectl get po --watch" to check
# NAME                                      READY   STATUS    RESTARTS   AGE
# one-green-core-ui-5497dd678f-dnb95        1/1     Running   0          15m
# one-green-core-telegraf-0                 1/1     Running   0          15m
# one-green-core-mqtt-0                     1/1     Running   0          15m
# one-green-core-water-controller-0         1/1     Running   0          15m
# one-green-core-tsdb-0                     1/1     Running   0          15m
# one-green-core-grafana-7886f7d45f-58fzt   1/1     Running   0          15m
# one-green-core-influxdb-0                 1/1     Running   0          15m
# one-green-core-sprinklers-controller-0    1/1     Running   1          15m
# one-green-core-api-756dfd65d7-snrkk       1/1     Running   0          15m
# USE CTL+C to quit watch
Now you can:
connect IoT devices on MQTT
access to Grafana, create dashboard, add alert management
access to Admin-UI
Access to services
If all services are up, use this command
sudo microk8s kubectl get services -n default
# NAME                      TYPE        CLUSTER-IP       EXTERNAL-IP   PORT(S)          AGE
# kubernetes                ClusterIP   10.152.183.1     <none>        443/TCP          3d12h
# one-green-core-ui         ClusterIP   10.152.183.208   <none>        8501/TCP         3d11h
# one-green-core-tsdb       ClusterIP   10.152.183.160   <none>        5432/TCP         3d11h
# one-green-core-mqtt       NodePort    10.152.183.79    <none>        1883:30181/TCP   3d11h
# one-green-core-influxdb   ClusterIP   10.152.183.202   <none>        8086/TCP         3d11h
# one-green-core-api        ClusterIP   10.152.183.64    <none>        8080/TCP         3d11h
# one-green-core-grafana    ClusterIP   10.152.183.177   <none>        80/TCP           3d11h
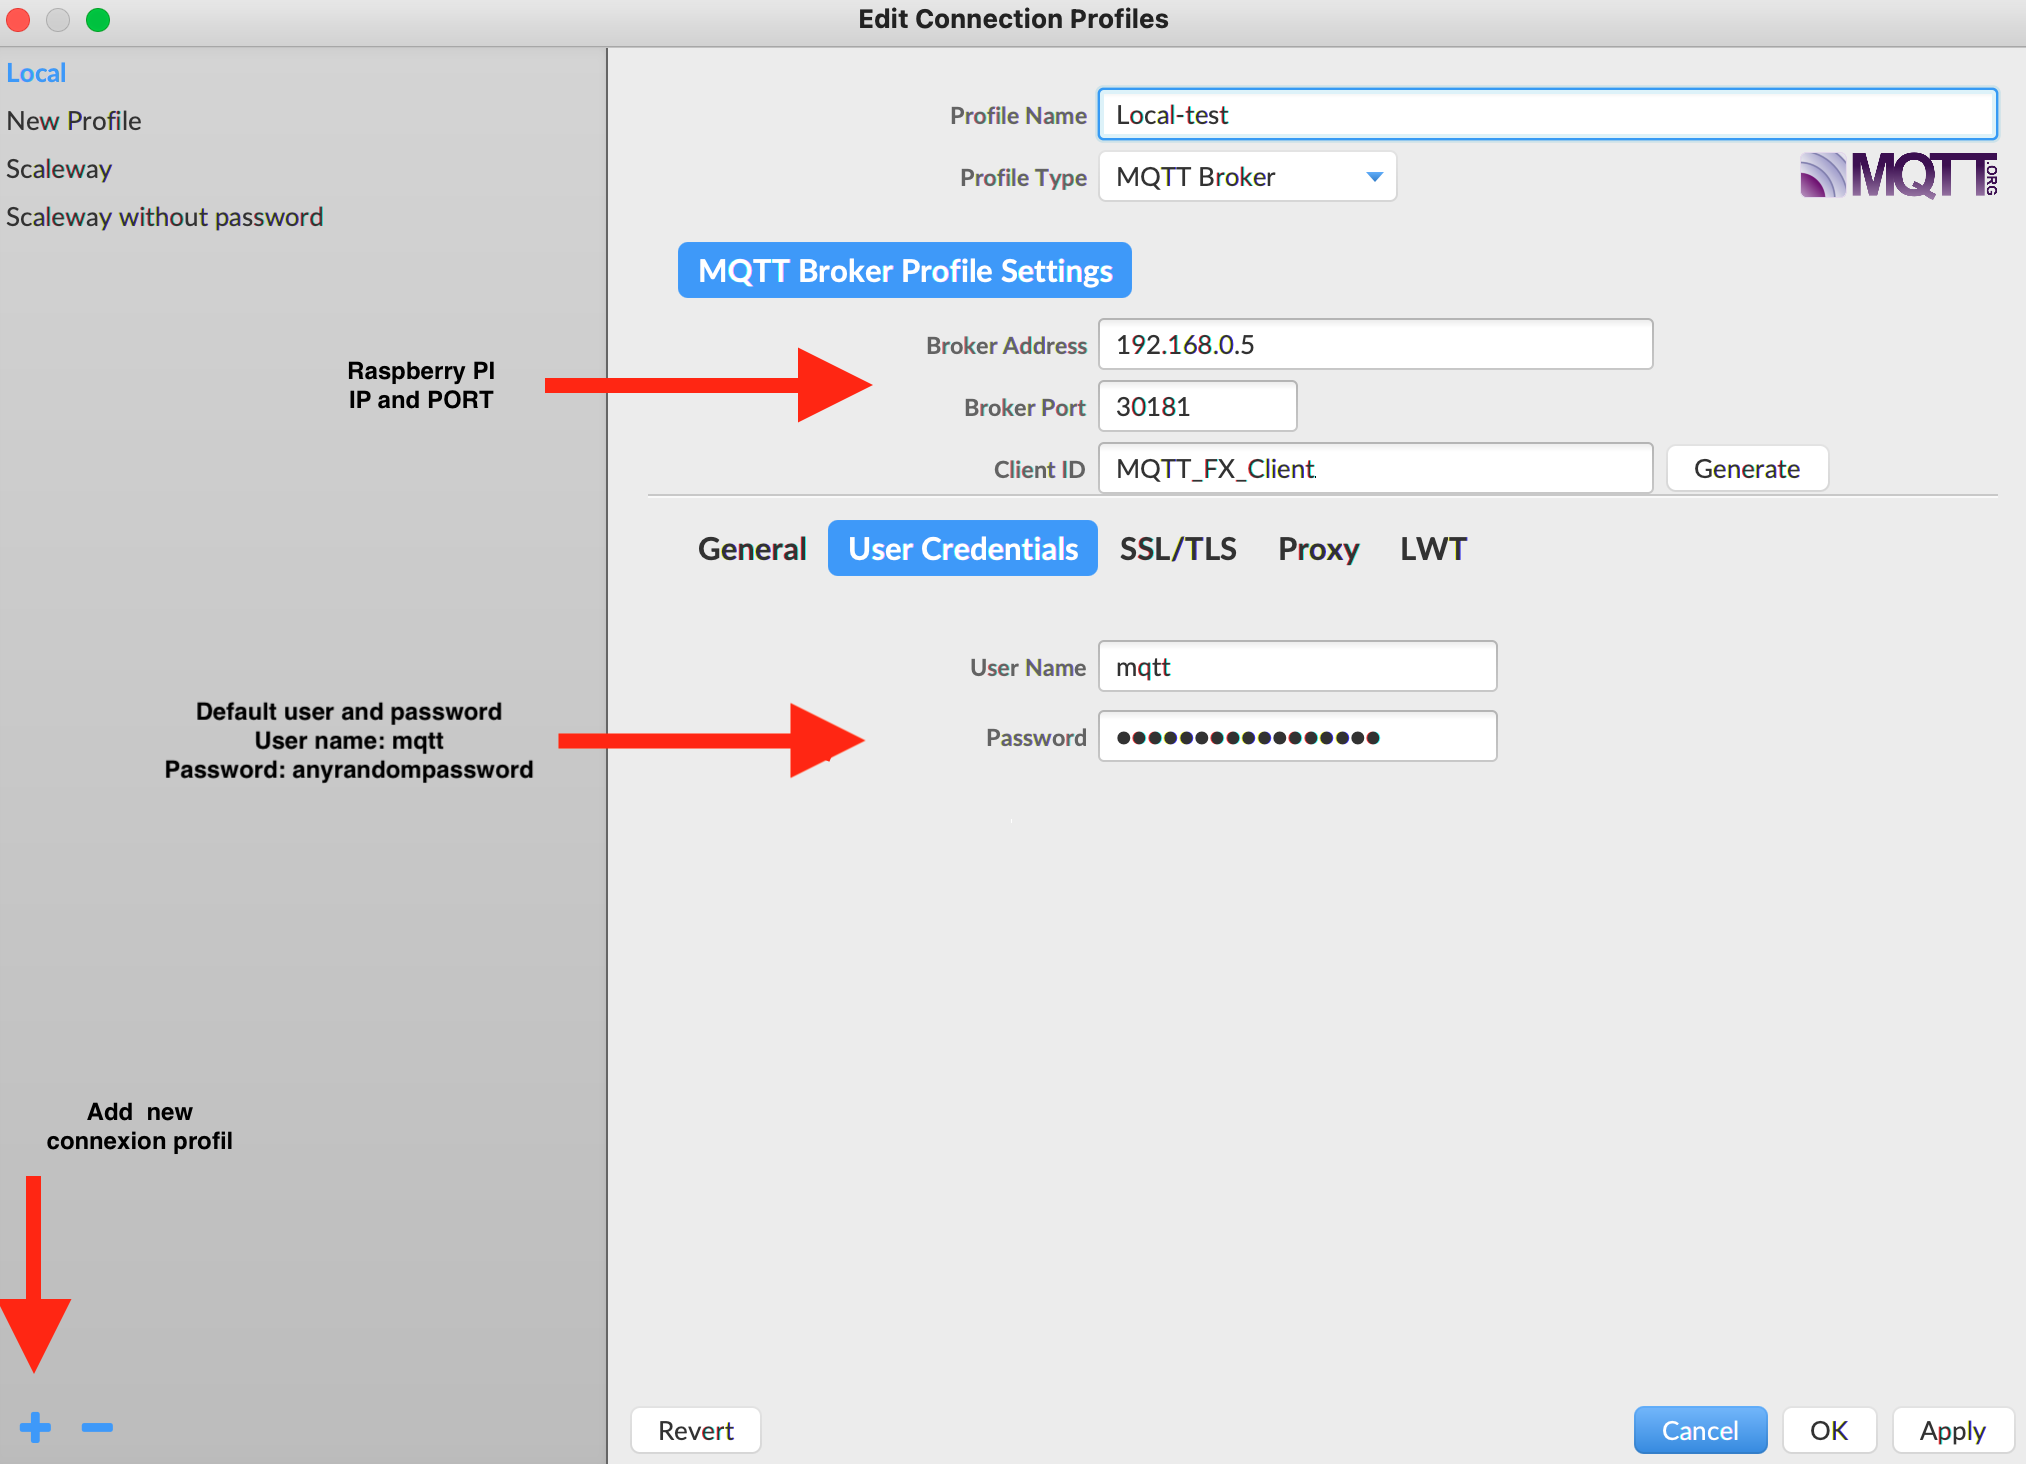
- Mqtt server
ip/dns: your_raspberry_pi_ip
port: 30181
default user: admin
default password: anyrandompassword
- Grafana
user: admin
password:
# use this cmd command::
sudo microk8s kubectl get secret --namespace default one-green-core-grafana -o jsonpath="{.data.admin-password}" | base64 --decode ; echo
# password is like
XqBSWrnJ8sy0bdOj9cYb0SMPXEY3oNfE8qdgveQG
- Core-ui
no user/password for now
Test MQTT connexion
- Software requirements
MQTT.fx (install from http://www.mqttfx.jensd.de/index.php/download)
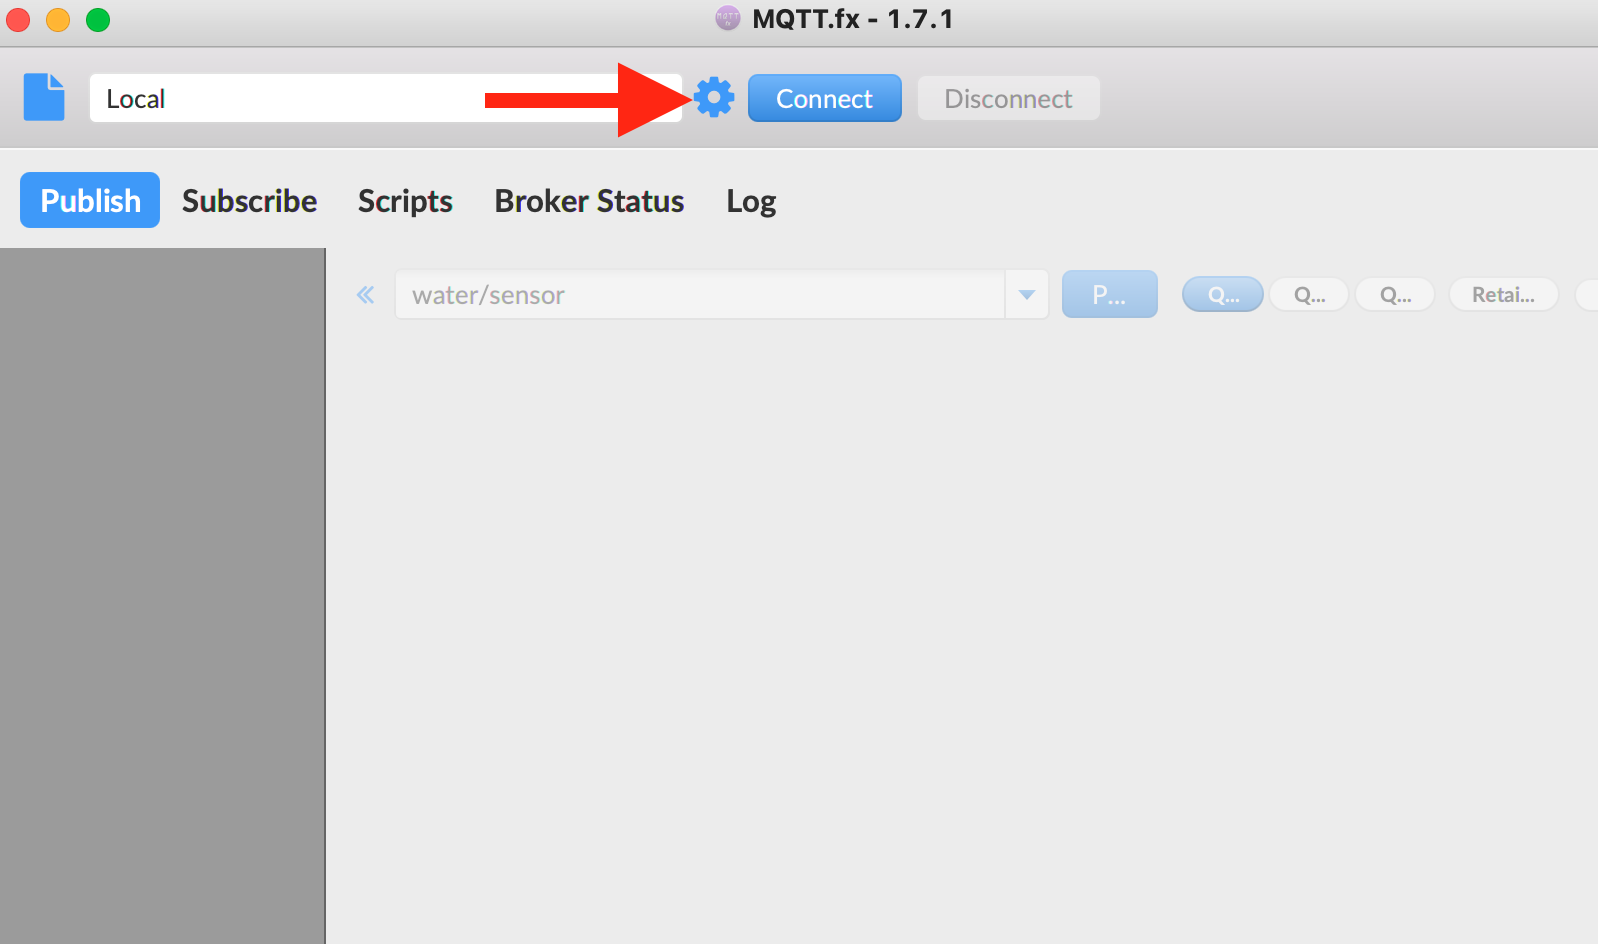
Stack is deployed on Raspberry, now we can connect to Mqtt broker to ensure Publish/Subscription is working. Use Mqtt server parameter to try connection, by following steps.
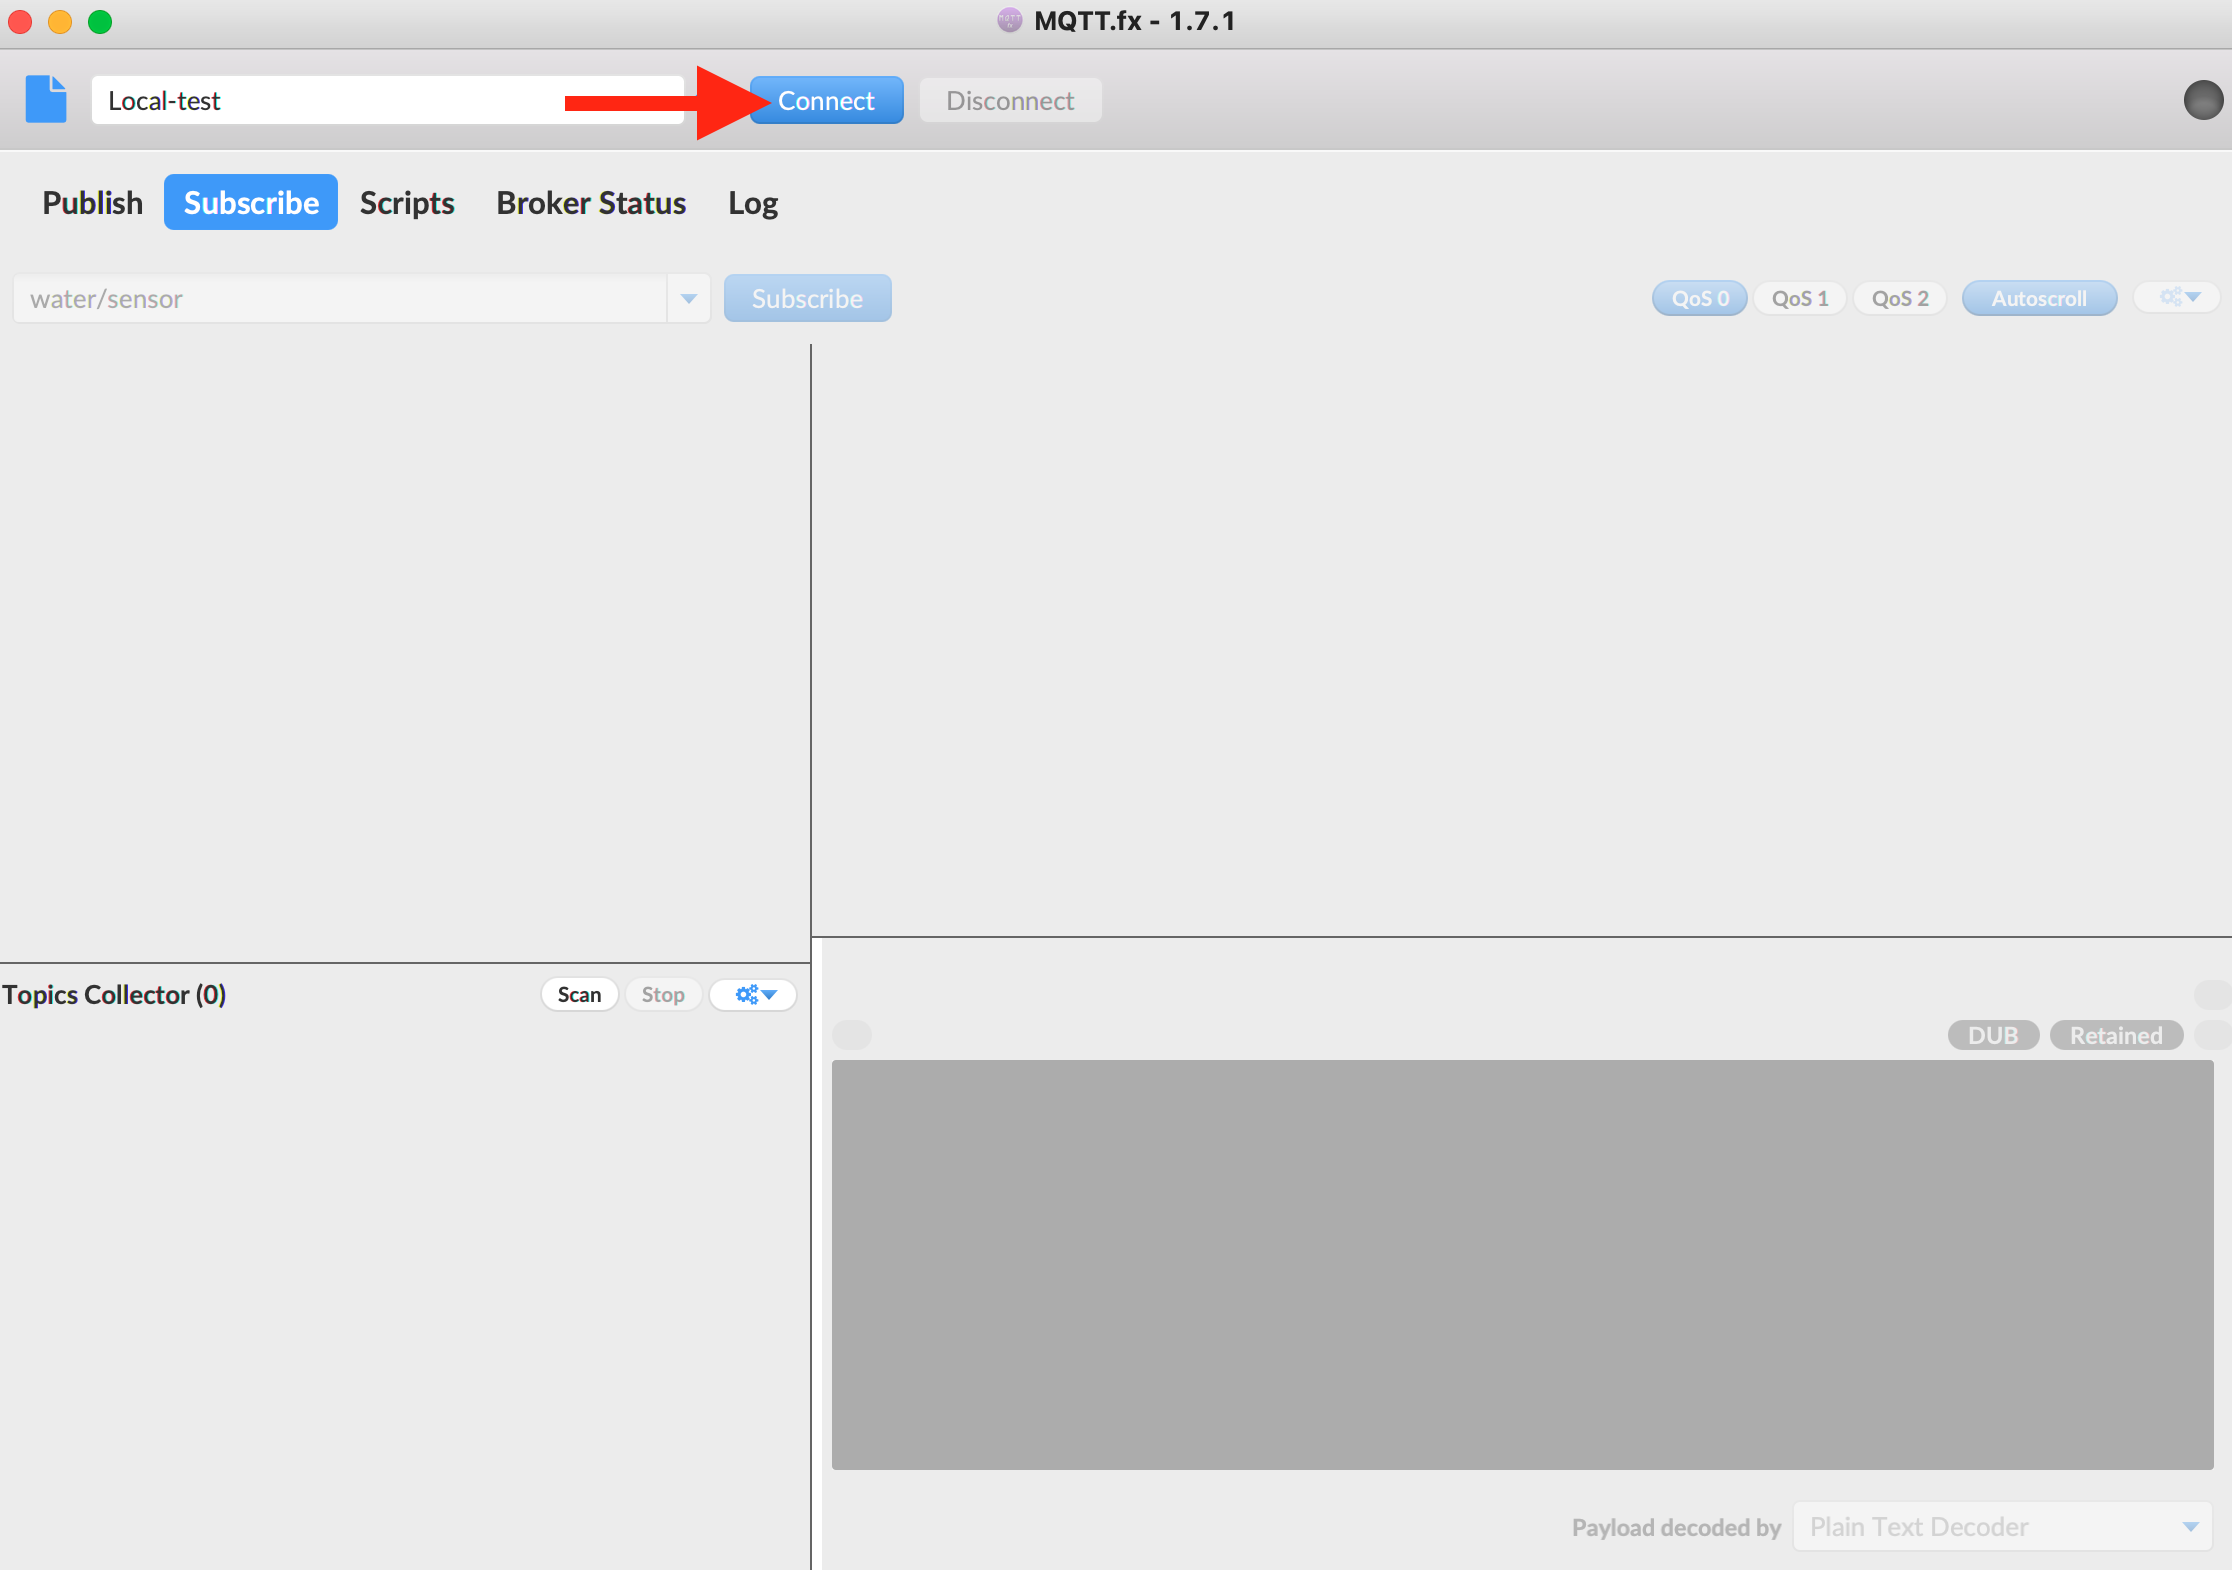
Once connected, we can test publish/subscribe on echo/test
First subscribe on topic echo/test
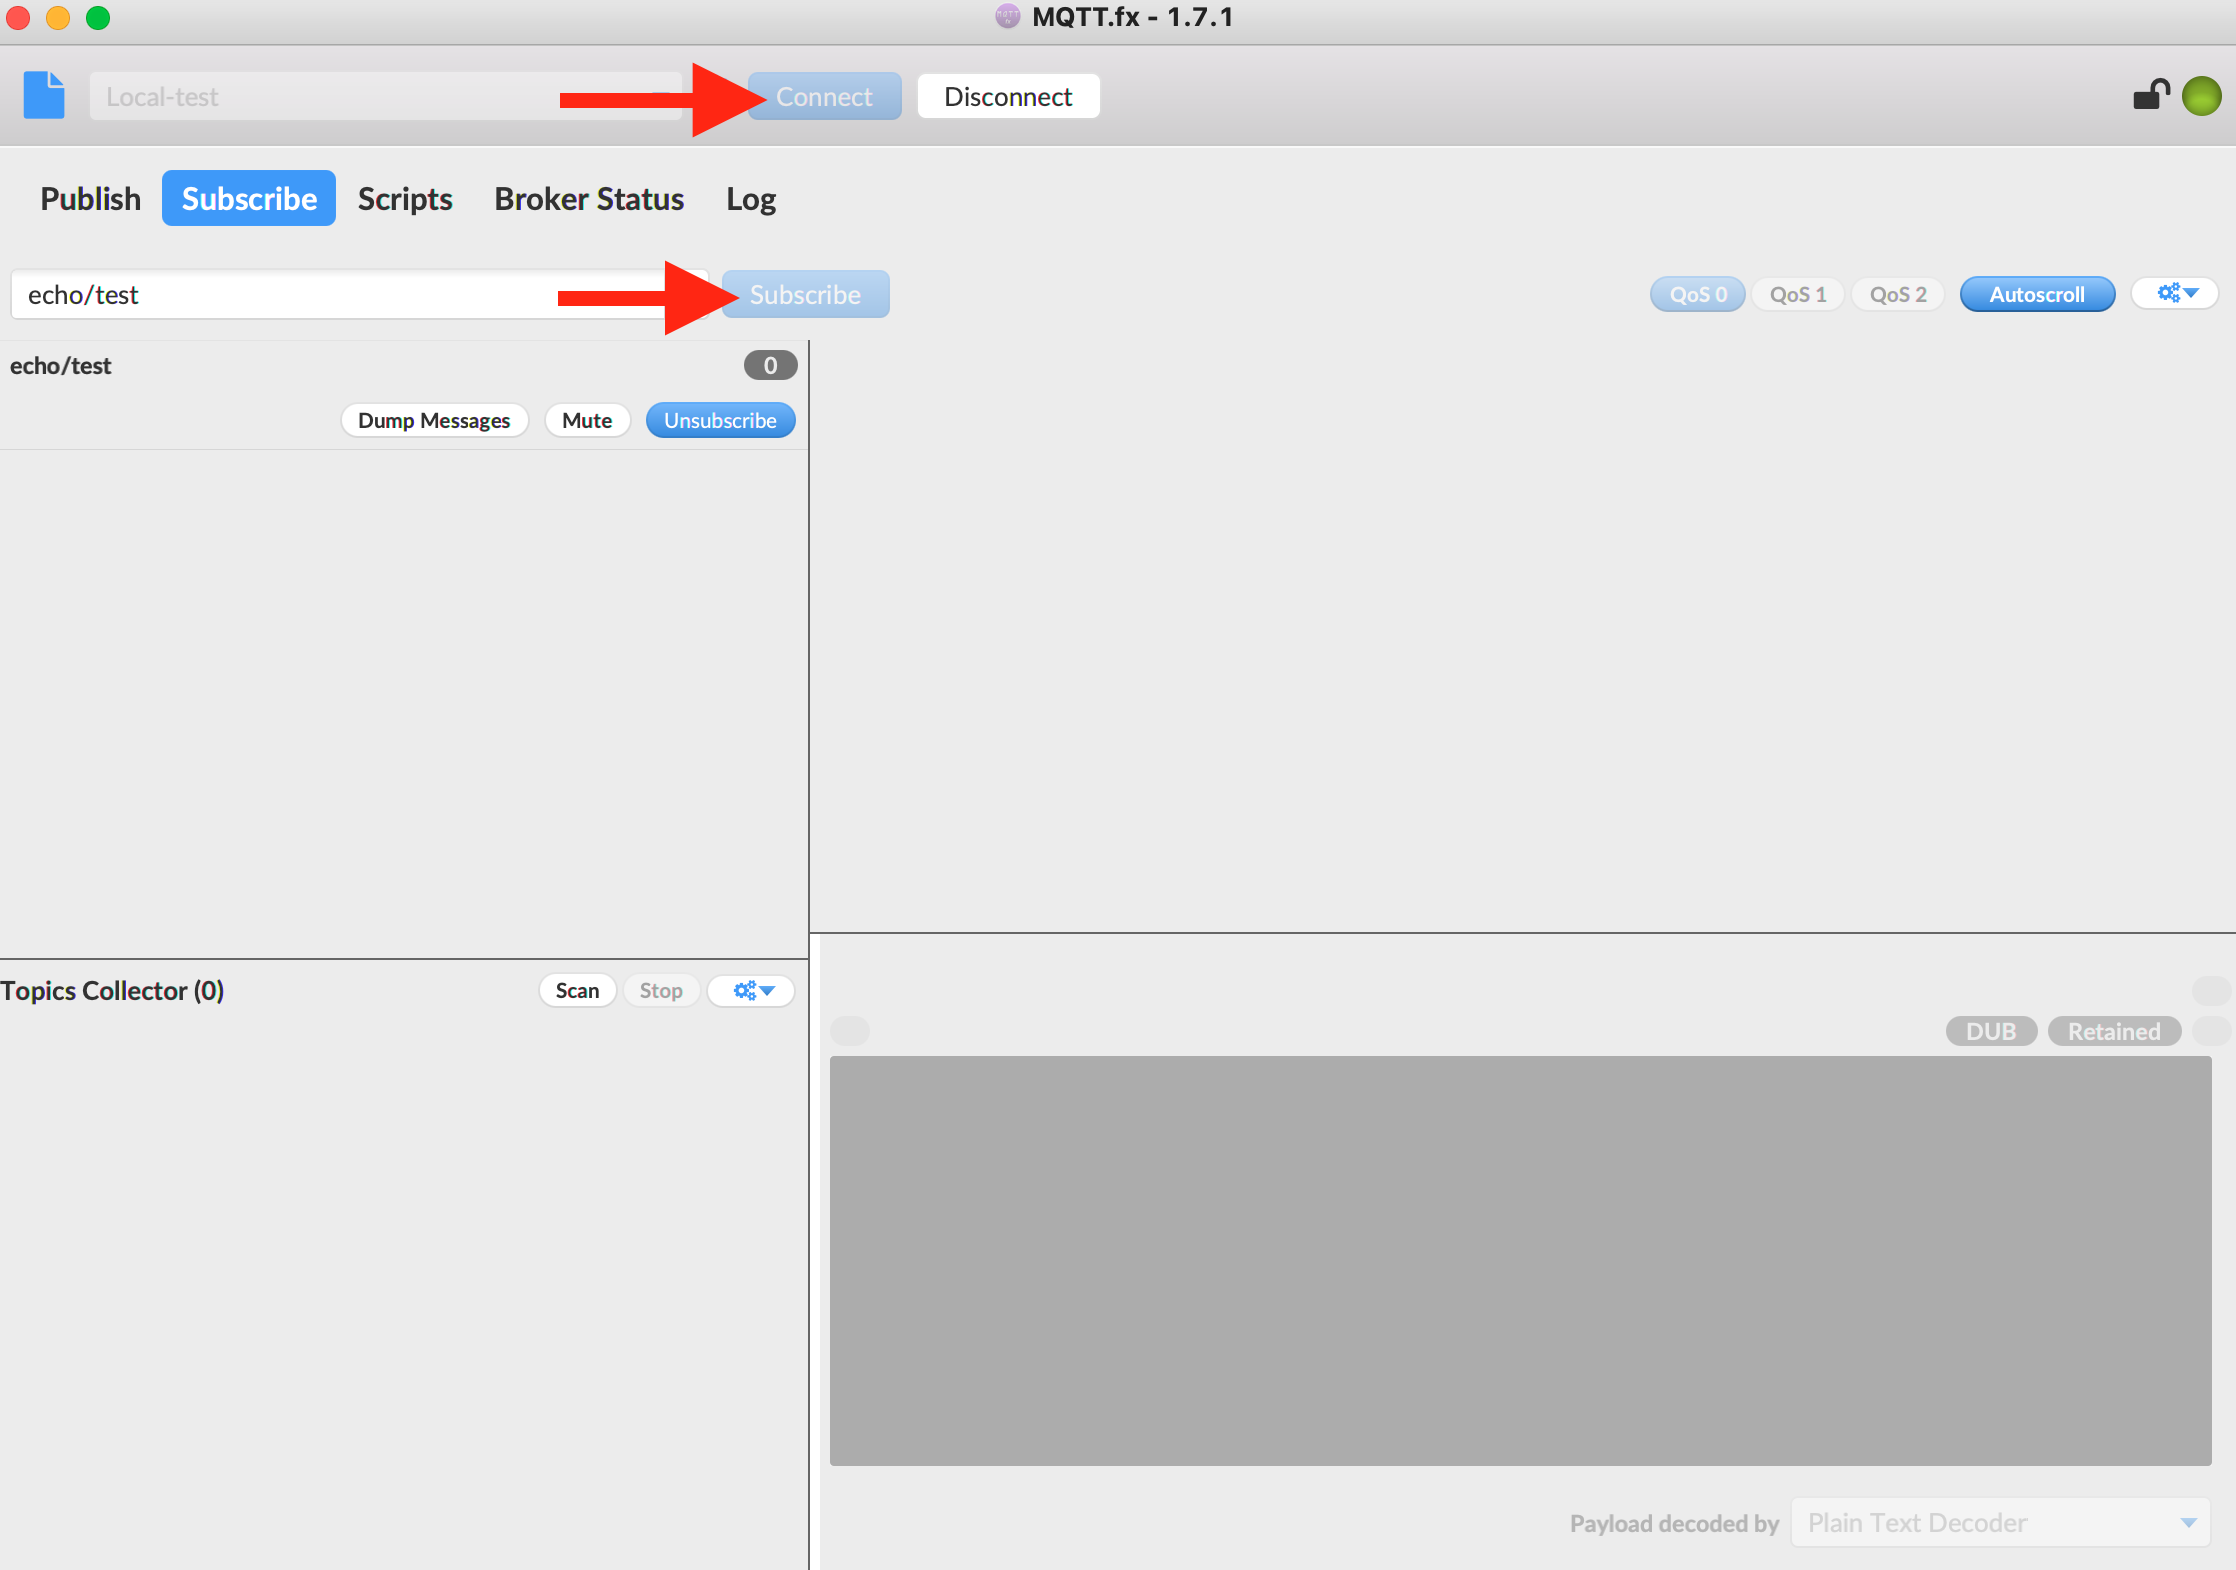
Then publish a message on topic echo/test
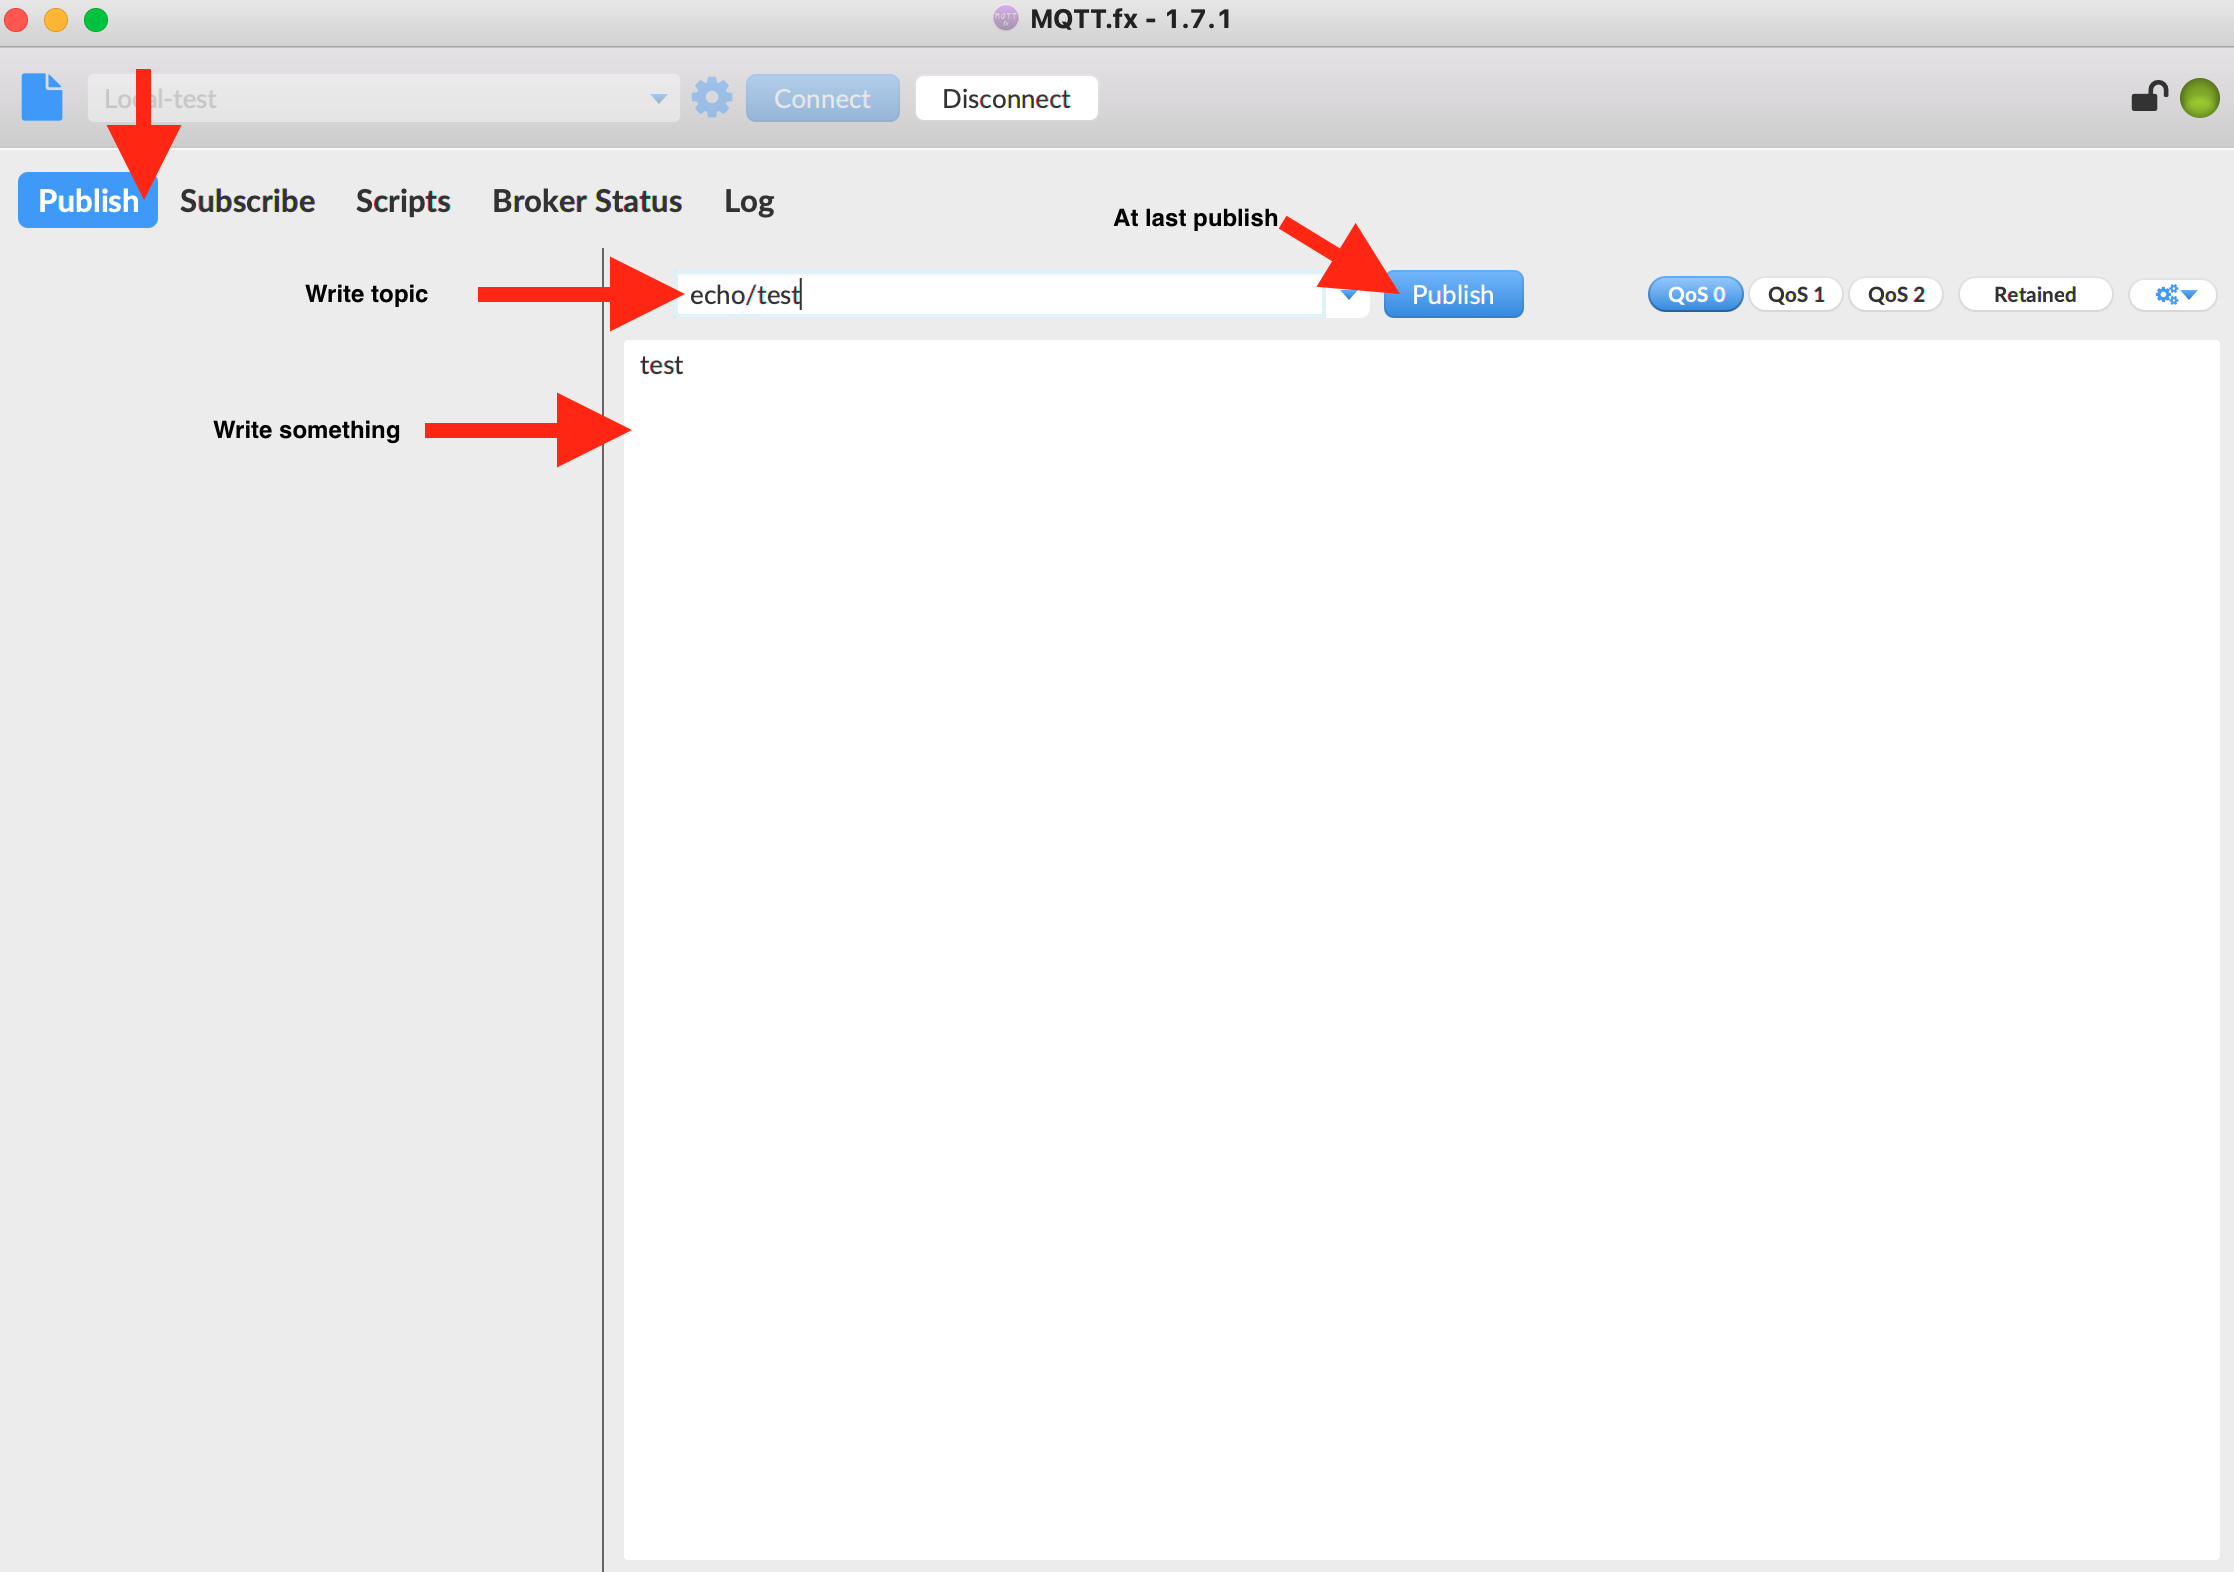
Go back to subscribe tab and check message is published
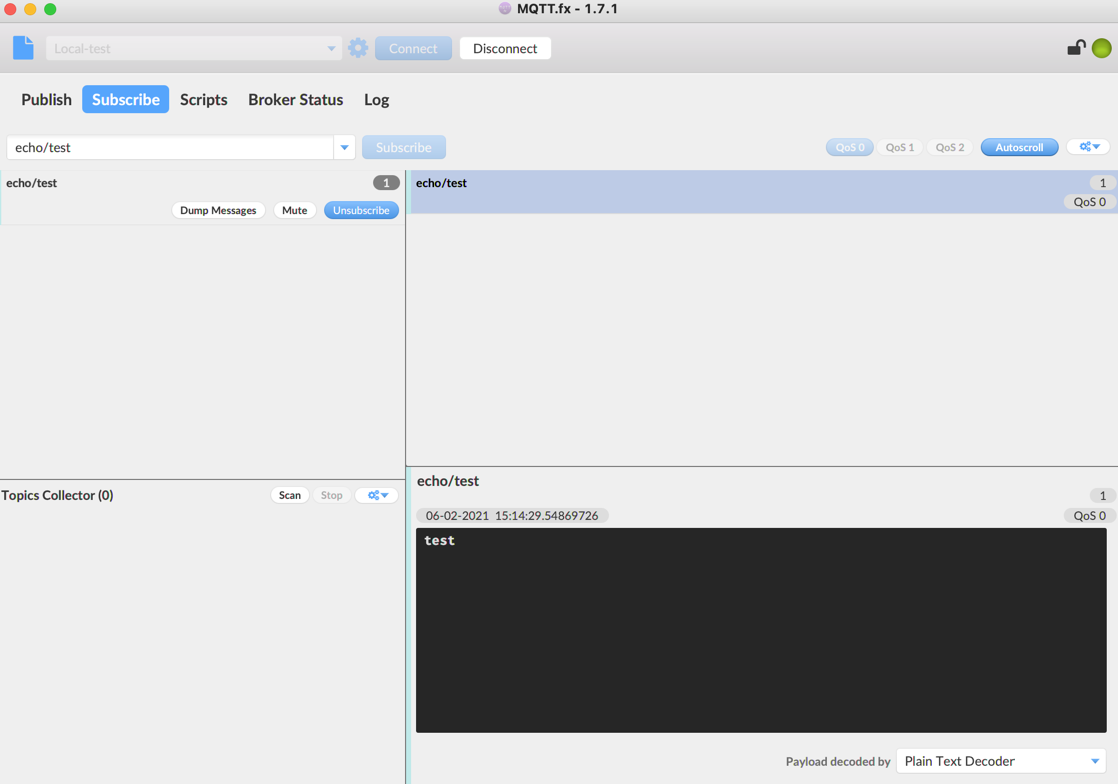
Note
If your message is received we can consider broker parameter are good :)
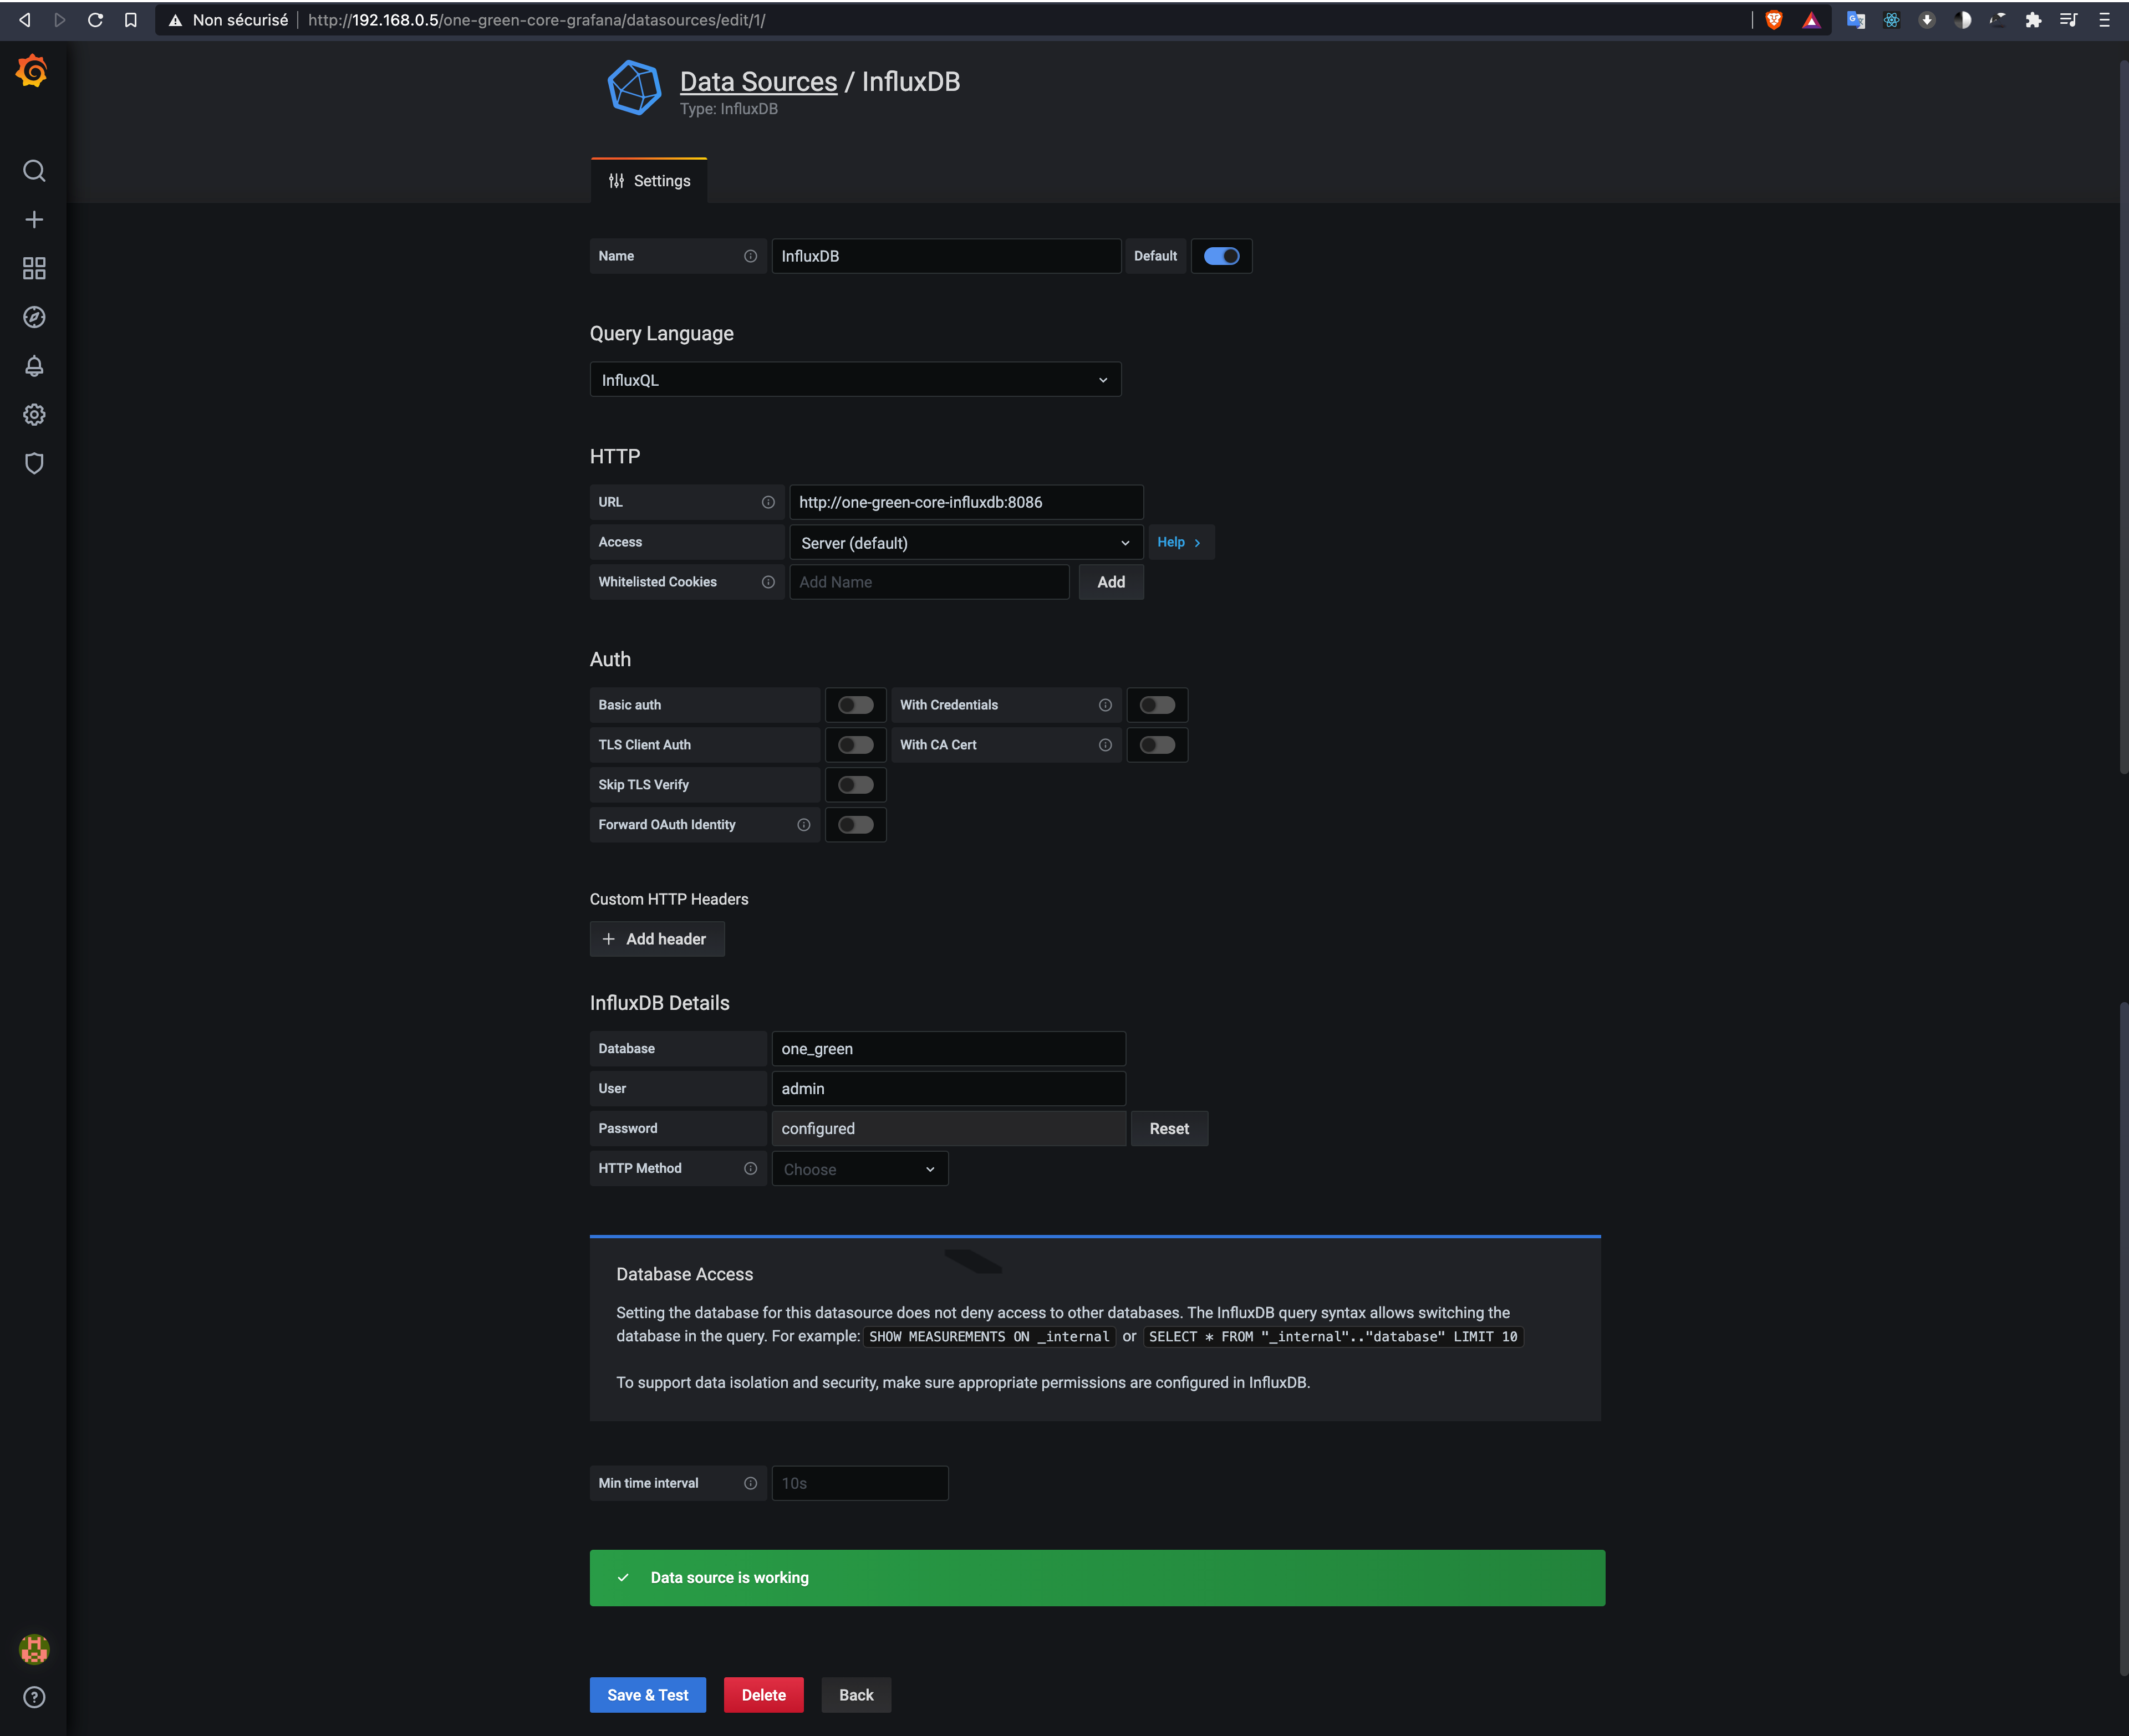
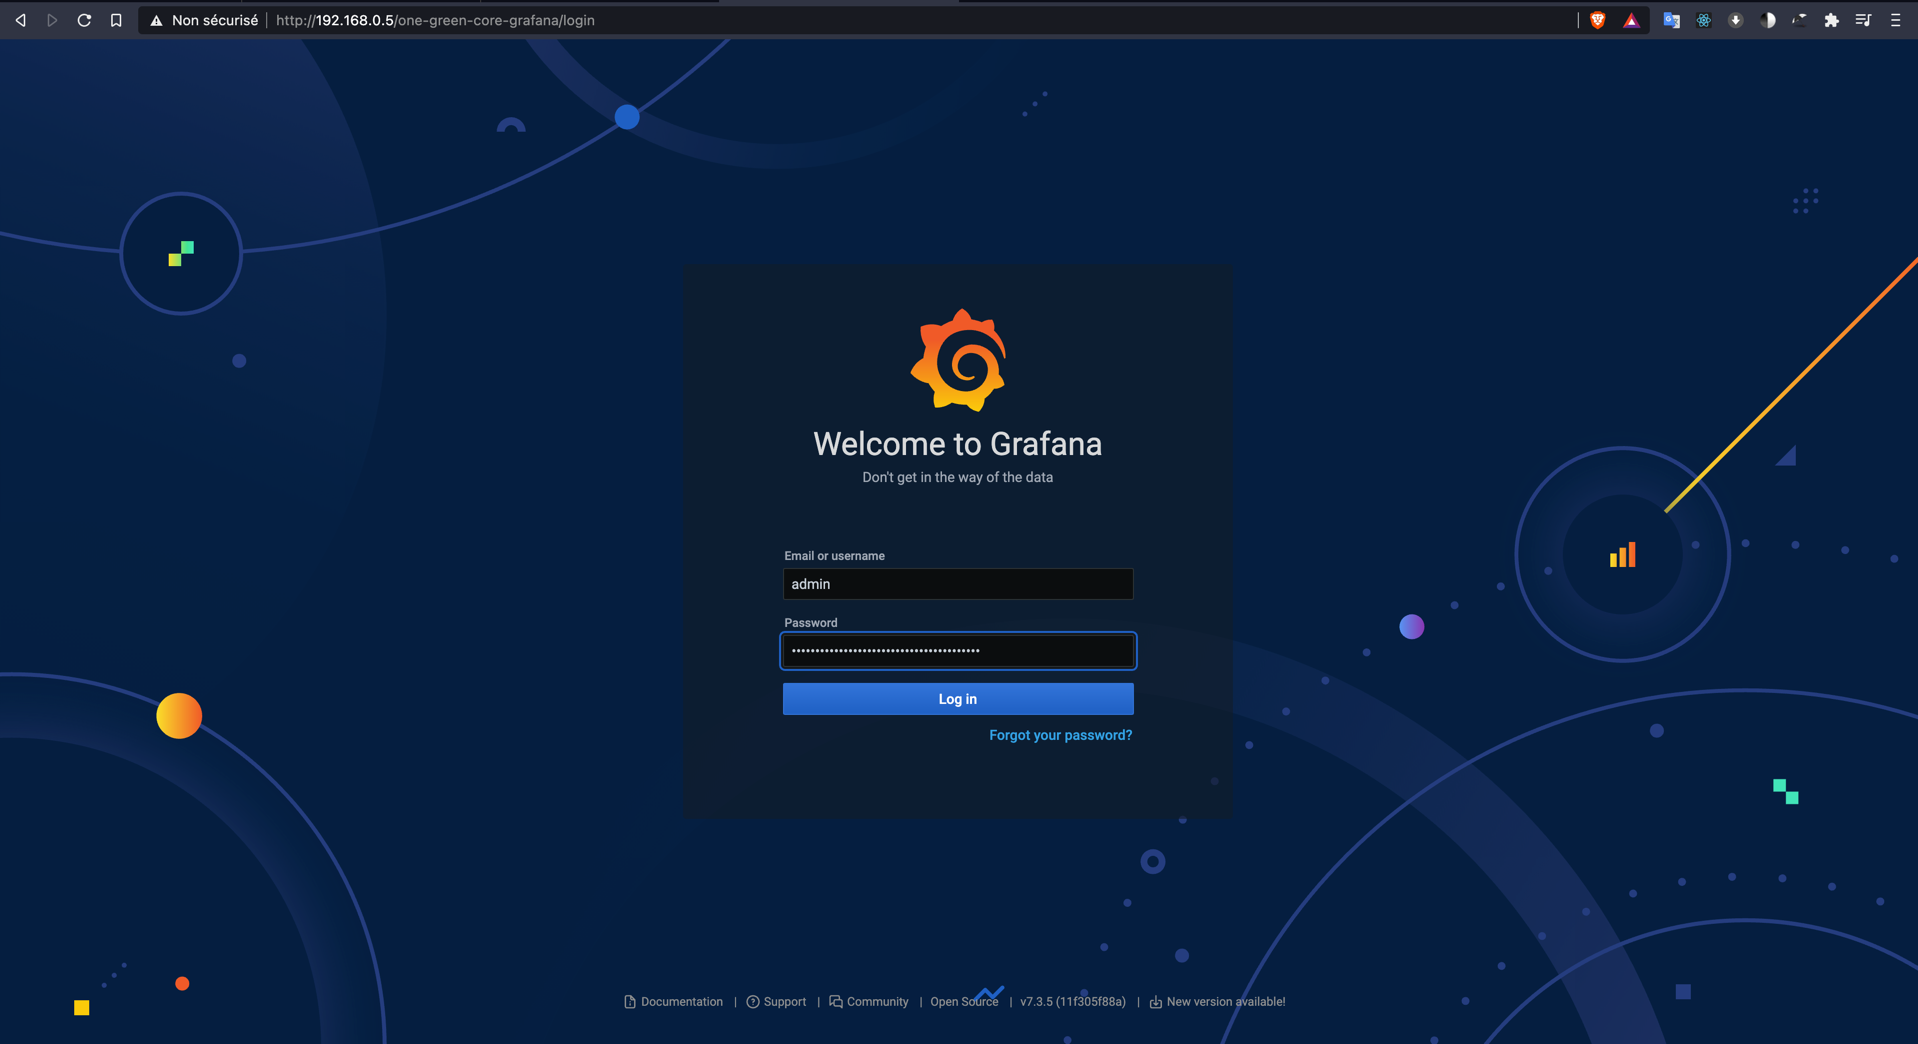
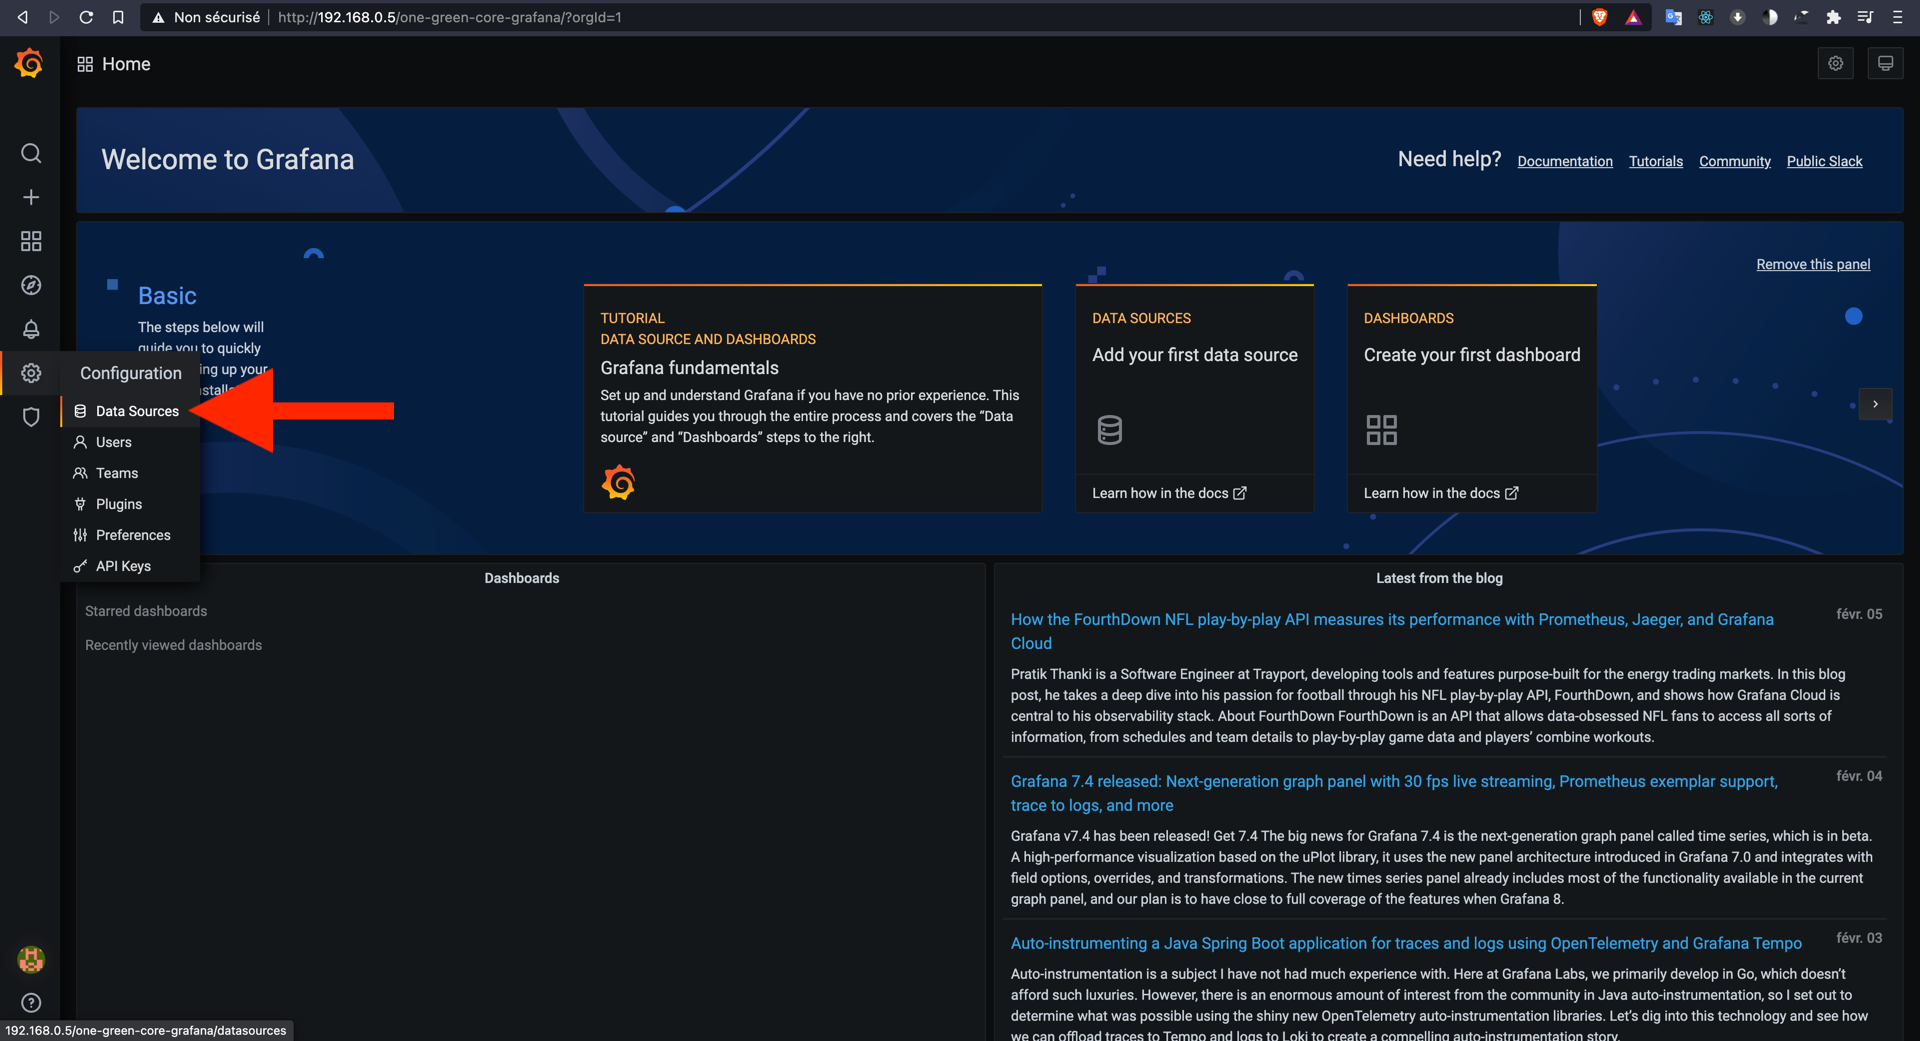
Setup Grafana
Open Grafana in browser with url: http://your_raspberry_pi_ip/one-green-core-grafana (user = admin, password = get password with cmd mentioned in Access to services)
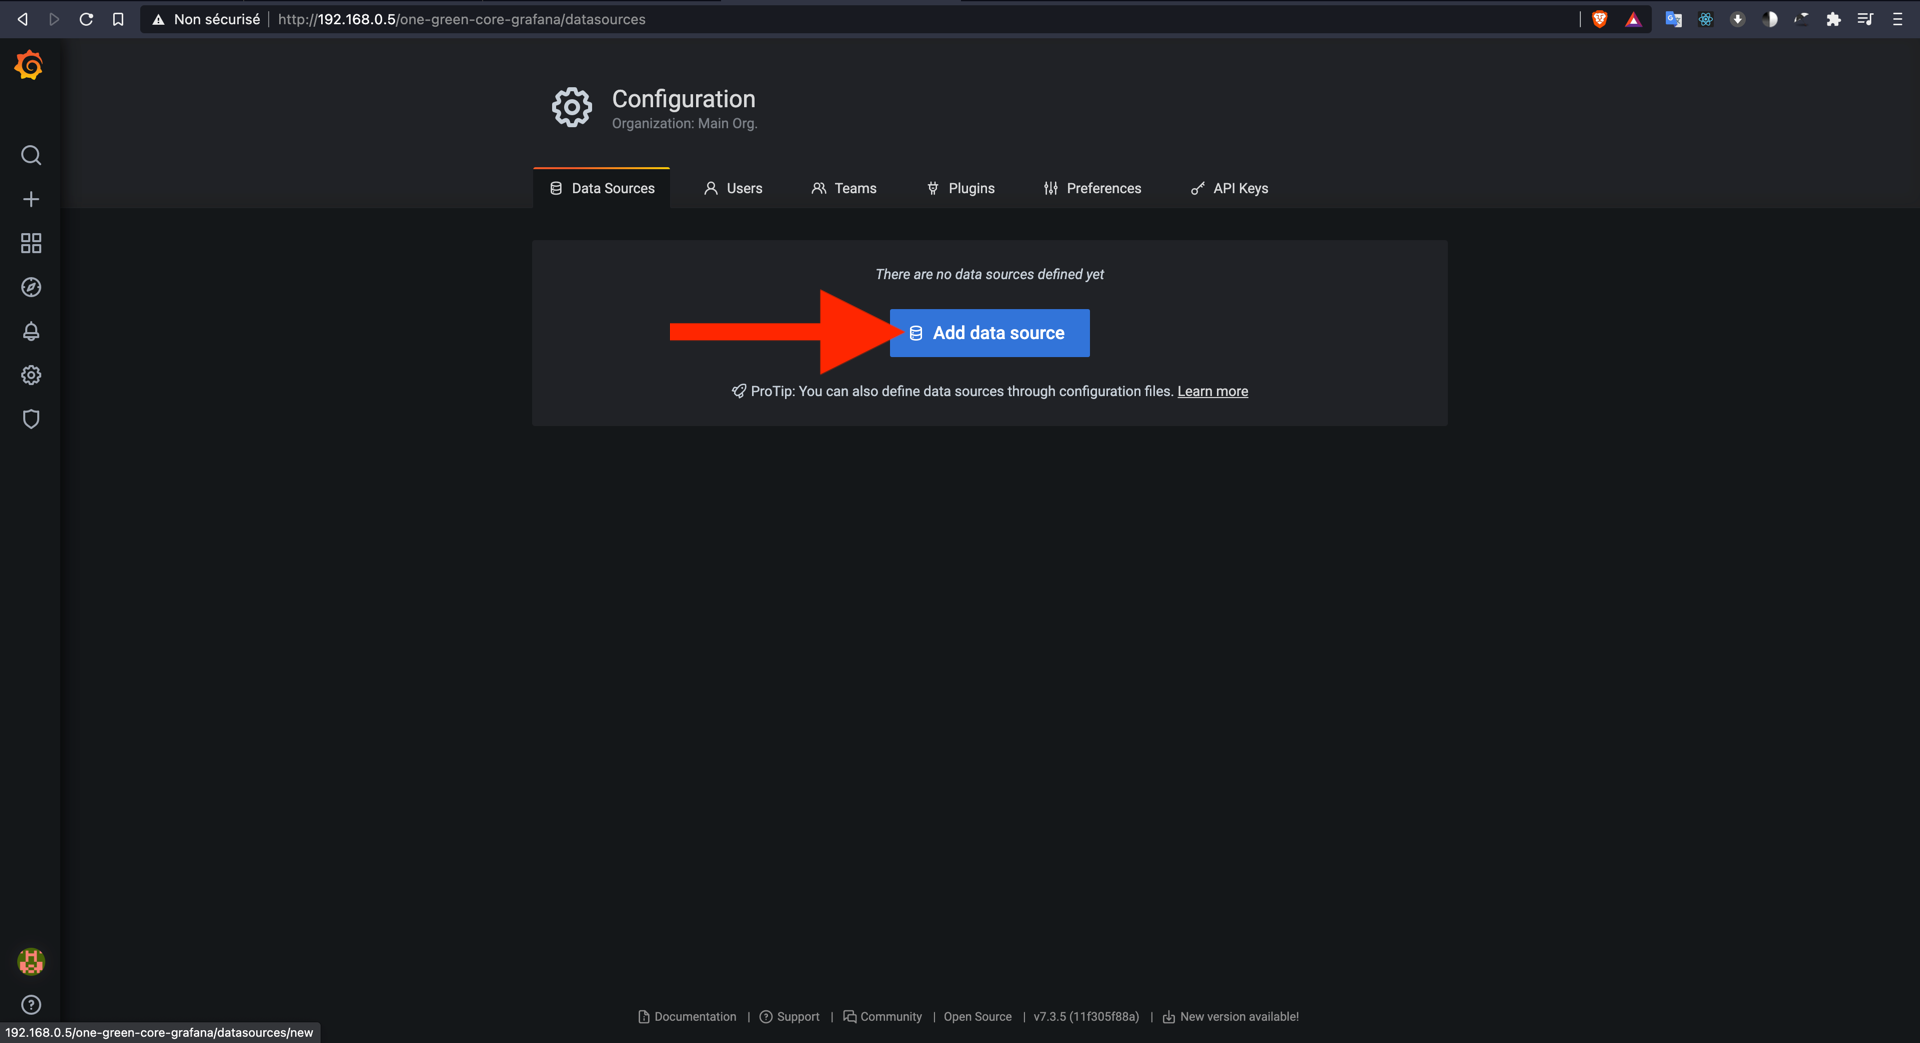
Once connected we must connect InfluxDB
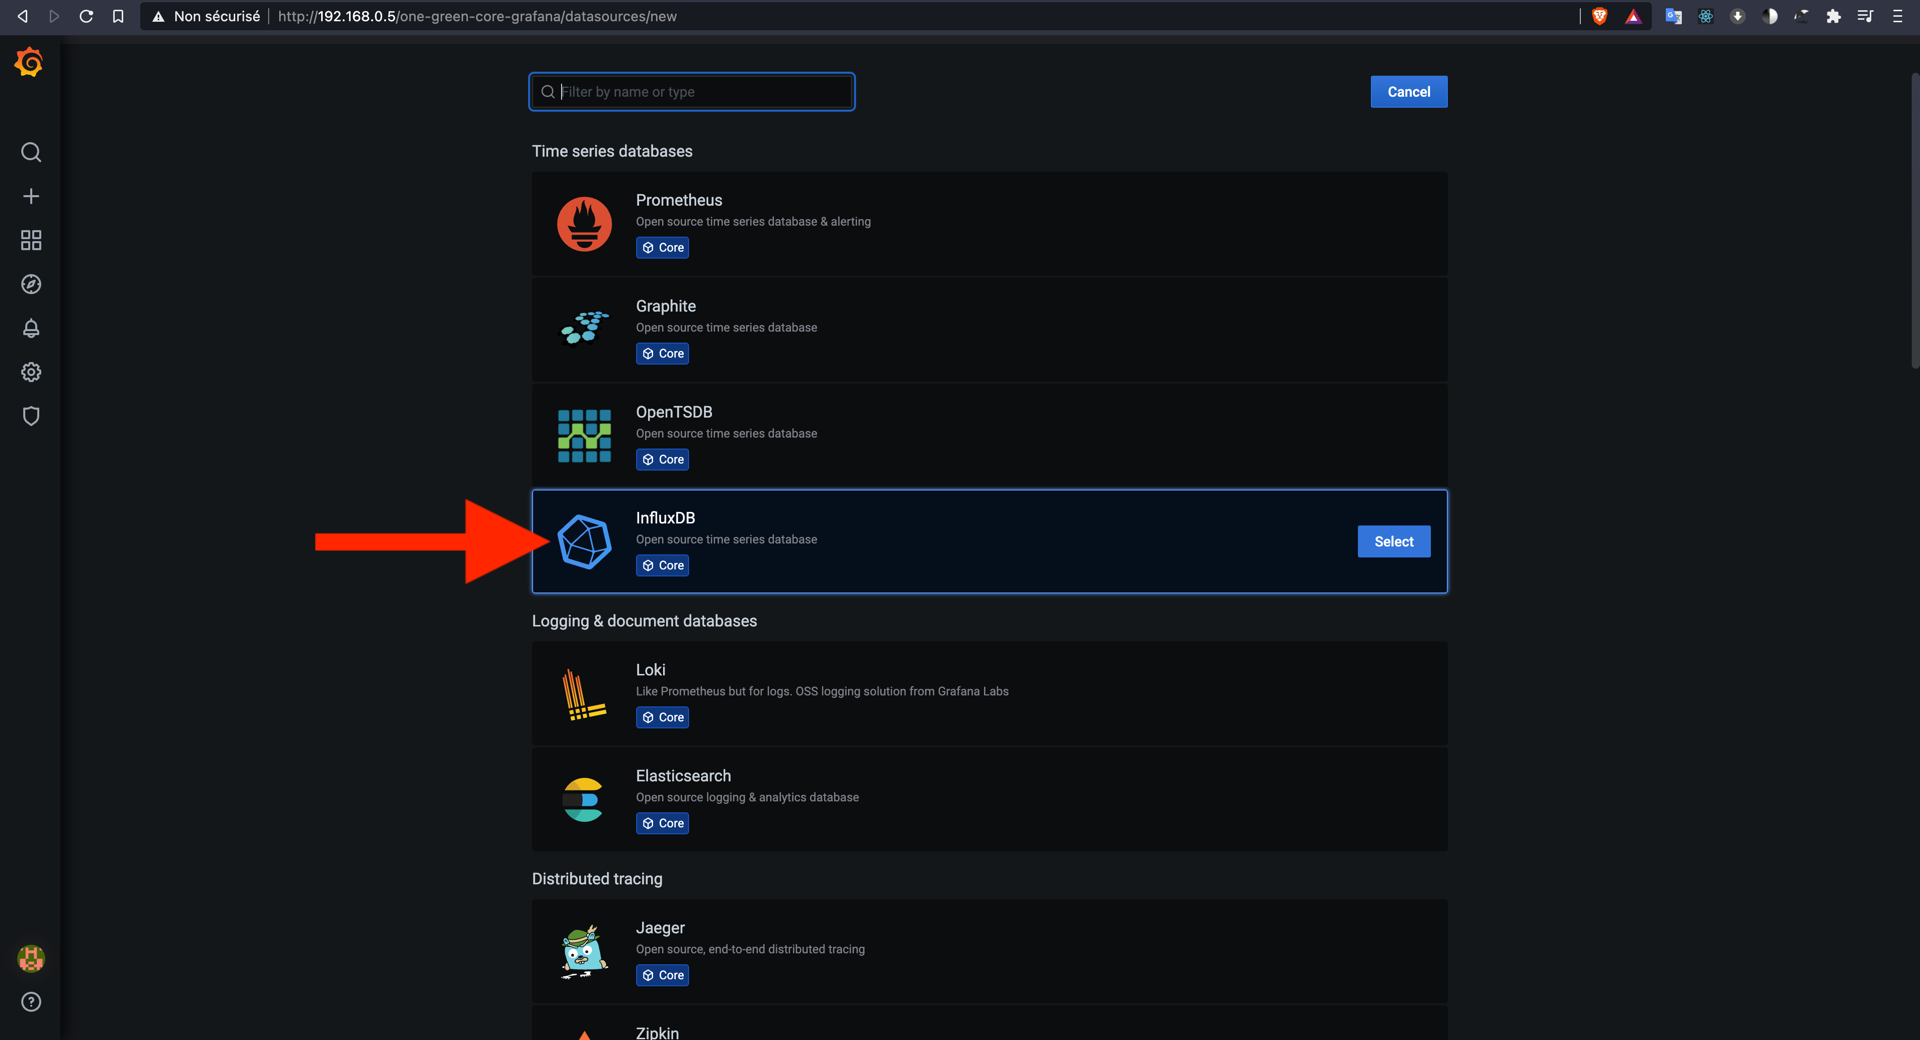
Default parameter:
[HTTP] URL : http://one-green-core-influxdb:8086
[InfluxDB Details] Database: one_green
[InfluxDB Details] User: admin
[InfluxDB Details] Password: anyrandompassword